
Ticker — Companion app to Ticketmaster ONE
Lean design principles brought Ticker from zero to one 50% faster, grew users from 40 to 1000, and increased retention by 40%
Ticker provided real-time sales data to live events professionals, reducing decision lag by 24 hours to inform critical business decisions. Zero to one product design.
Role
Senior user experience designer
Team
Product, Scrum, Eng Lead, Eng team of 5,
Visual Designer from the Design System team
Timeline
3 months to bring our pilot to market with lean UX
Additional enhancements over time
Responsibilities
Lean user research, Rapid prototyping, Design, Jandoff
Mentored a mid-level designer
Project overview + Impact
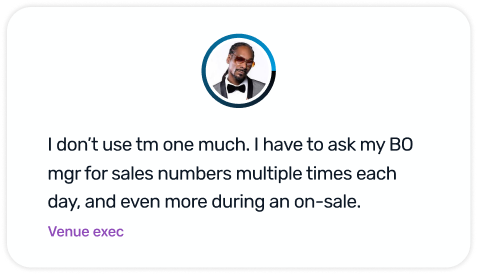
Venue execs and box office managers needed quick access to real-time sales data in order to make informed decisions throughout the life of their events, especially during on-sales. I led experience design for a real-time reporting companion to Ticketmaster ONE, in order to get them hooked on Ticketmaster’s data. Instantly accessible data reduced decision lag by 48 hours, and increased users from 30 to 1000.
The company’s leadership also needed to reduce the time it took Ticketmaster to bring features to market, and I partnered with Thoughtworks. for a lean transformation to get the MVP out the door. Compared to the company’s baseline, we reduced time to market by 50%.


Problem
Box office managers and venue execs rely on delayed reports (24 hours) from tm one to track ticket sales, which hinders decision-making and results in missed opportunities to adjust marketing strategies, or respond to urgent technical issues.


Easily find your most important event’s data
View all your upcoming events, flag critical ones, view your event’s reports.
View your seat status data in the form that makes sense
Access your seat map from your sales summary
Never call your CSM to ask for the data’s freshness again
I concepted interactive date stamps to reduce calls to Client Support by visualizing the data’s freshness.
VIew your event’s trends in the segments you need
Provide trends in standard reporting segments, with your on-sale and event dates called out
I planned and conducted our user research within a lean framework
Finding the right SaaS user resulted in stronger learnings
Partnered with Customer Success Managers to methodically identify candidates across our segments, spanning role, venue size, and event type.
Some research is better than no research, utilize your company resources
Leveraged a monthly continuous user research effort with new employees to TM to fill in the gaps.

Artifacts are stronger than bullet points
Conducted synthesis with post-its and posterboard, and shared the strongest findings with stakeholders with video clips from the session.


-
Sign in page
Make it easy for VE’s and BOM’s to access their events, leveraging the latest styles and patterns from tm ONE's design system. -
Logging in tm ONE was always an issue requiring it once every 30 minutes, the mobile form factor made this worse.
We implemented rolling logins to reduce friction to using ticker.


-
Upcoming events list
Make it easy for VE’s and BOM’s to access all their events, find the most important events, and highlight concerns. -
Sort order & Loading
Upcoming events lists the user's events in chronological order, which improved task completion by 22% in usability testing. I removed tm one's pagination patterns by providing infinite scroll, and aligned with eng on a lightweight method to ensure that events were always loaded before they were visible while scrolling.
List Design
Used mobile to push the org to groom their data, and cut unnecessary text.
Improve upon tm one's list items by reducing visual noise, applying legible text sizes, and adding white space. As a bonus, we partnered with eng to include images from tm's database, which hadn't been possible historically, users loved that a reporting app looked exciting.Search
Depending on the user's organization, some users had lots of events (100+), and some only had a handful. Search was Implemented as a simple string query for MVP. -
Visual indicators for sell-through
Designed low/mdm/high (red/yellow/green) bar graphs for sell-through indicators were helpful and easy to understand for both personas. For launch I compromised with product and eng on visualizing cache’d data, but followed up after release to power the sell-through indicators with real-time data. Without these features, users mentioned it could take a long time to tap in and out of events, or incur cognitive load to remember which ones need urgent attention. -
Feature: Flagging
Flagging was implemented to make it easy to track the events most important to them with simple Iconography. By placing the icon in a consistent scan line on the left side, it increased scannability. We followed the HIG and adopted 14pt font for legibility.


-
Sales today
Provide the most important sales metrics for today's numbers for VE's and BOM's -
Leveraged 1:1 sessions and surveys to identify daily real-time reporting metrics. For the mobile form factor we kept this report's content minimal, focused on what they need today.
% and Integers
A common problem we needed to tackle while crafting tm ONE was that one-size-fits-all designs don't always meet everyone's needs. Some of our users needed percent, and some of our users needed integers. We ultimately aligned on having blue text be tappable, and they can toggle between integers and percents, and the app would always remember their last preference.
This worked well for MVP and there were no complaints, but if there were concerns we flagged this as an interaction pattern that could be improved upon with more time.


-
Sales summary
Help users understand their venue ticket sales distribution data compared to their event configuration. -
Seat Map
Users had been asking for seat map reports, but the org wasn't sure what they needed, or which solution to move forward with.
I executed lean user research with surveys and prototyped several seat map reports.Users need to see how their events are selling.
Individual seat data was not needed for our use cases, users needed to see how they venue was selling. This simplified complexity, and brought the feature to market in half the time.


-
Sales trends
Provide the sales trends for the event in the segments users commonly need to analyze. -
To bring trends to life we confirmed what segments were most important, and identified Onsales and Event Dates as days worth calling out.
I wanted the trend line to be the hero, and took the entire screen real estate to bring the trend line to life, and make dragging the slider easier easier with a larger hitbox.


-
Attendance
Real-time report, primarily for venue operations and execs to triage urgent issues with ticket scanners during the event, and make the call to start the event. -
Research helped determine the MVP
A simple list and visual helped users identify their gates and visually identify which devices were generating errors.We outlined potential future improvements to leverage notifications and automate getting events started.
Filling in the venue map in real-time could had interest in identifying

Key learnings from our lean transformation
Kicking off high-priority efforts alongside key partners and stakeholders avoids churn downstream
Walking away with a written agreement on agreed upon priorities that the product manager and I could hold our cross-functional partners, and executive stakeholders to. By eliminating waste and miscommunication, we shaved months off Ticketmaster’s historically slow product releases.
Lean user research alongside stakeholders smooths over sign-offs
Led lean user research to keep the projects and features moving along, inviting our stakeholders along so they could witness and collaborate on the how and why behind our design decisions. This ensured we kept the users centered in their decision-making process. Research was a mix of 1:1 interviews, and usability tests. We were able to meet a few in person, and conducted the majority remote.
Using the walls as a visual kanban kept our stakeholders and team aligned on progress
High priority projects can be difficult to follow for anxious leaders when progress is tracked in multiple places.

For a brief visual over of the companion SaaS ecosystem
Check out Ticketmaster ONE
